Benchmarks
Performance benchmarks for parallel scaling on Gadi — NCI’s supercomputer.
System
| Property | Value |
|---|---|
| System | Gadi (NCI) |
| CPU | Intel Xeon Platinum 8274 (Cascade Lake) 3.2 GHz |
| Cores per node | 48 (2 × 24-core sockets) |
| Compiler | gcc 14.1.0 |
Strong Scaling
A fixed problem size of $256^3$ is distributed across an increasing number of threads. Runtime is wall-clock time in seconds.
Results
| Threads | Runtime (s) | Speedup | Efficiency (%) |
|---|---|---|---|
| 1 | 253.6 | 1.00 | 100 |
| 2 | 123.9 | 2.00 | 100 |
| 4 | 64.3 | 3.94 | 98.6 |
| 8 | 32.8 | 7.73 | 96.7 |
| 16 | 16.8 | 15.11 | 94.4 |
| 32 | 8.7 | 29.12 | 91.1 |
| 48 | 6.5 | 38.99 | 81.2 |
Speedup = T₁ / Tₙ · Efficiency = Speedup / N × 100
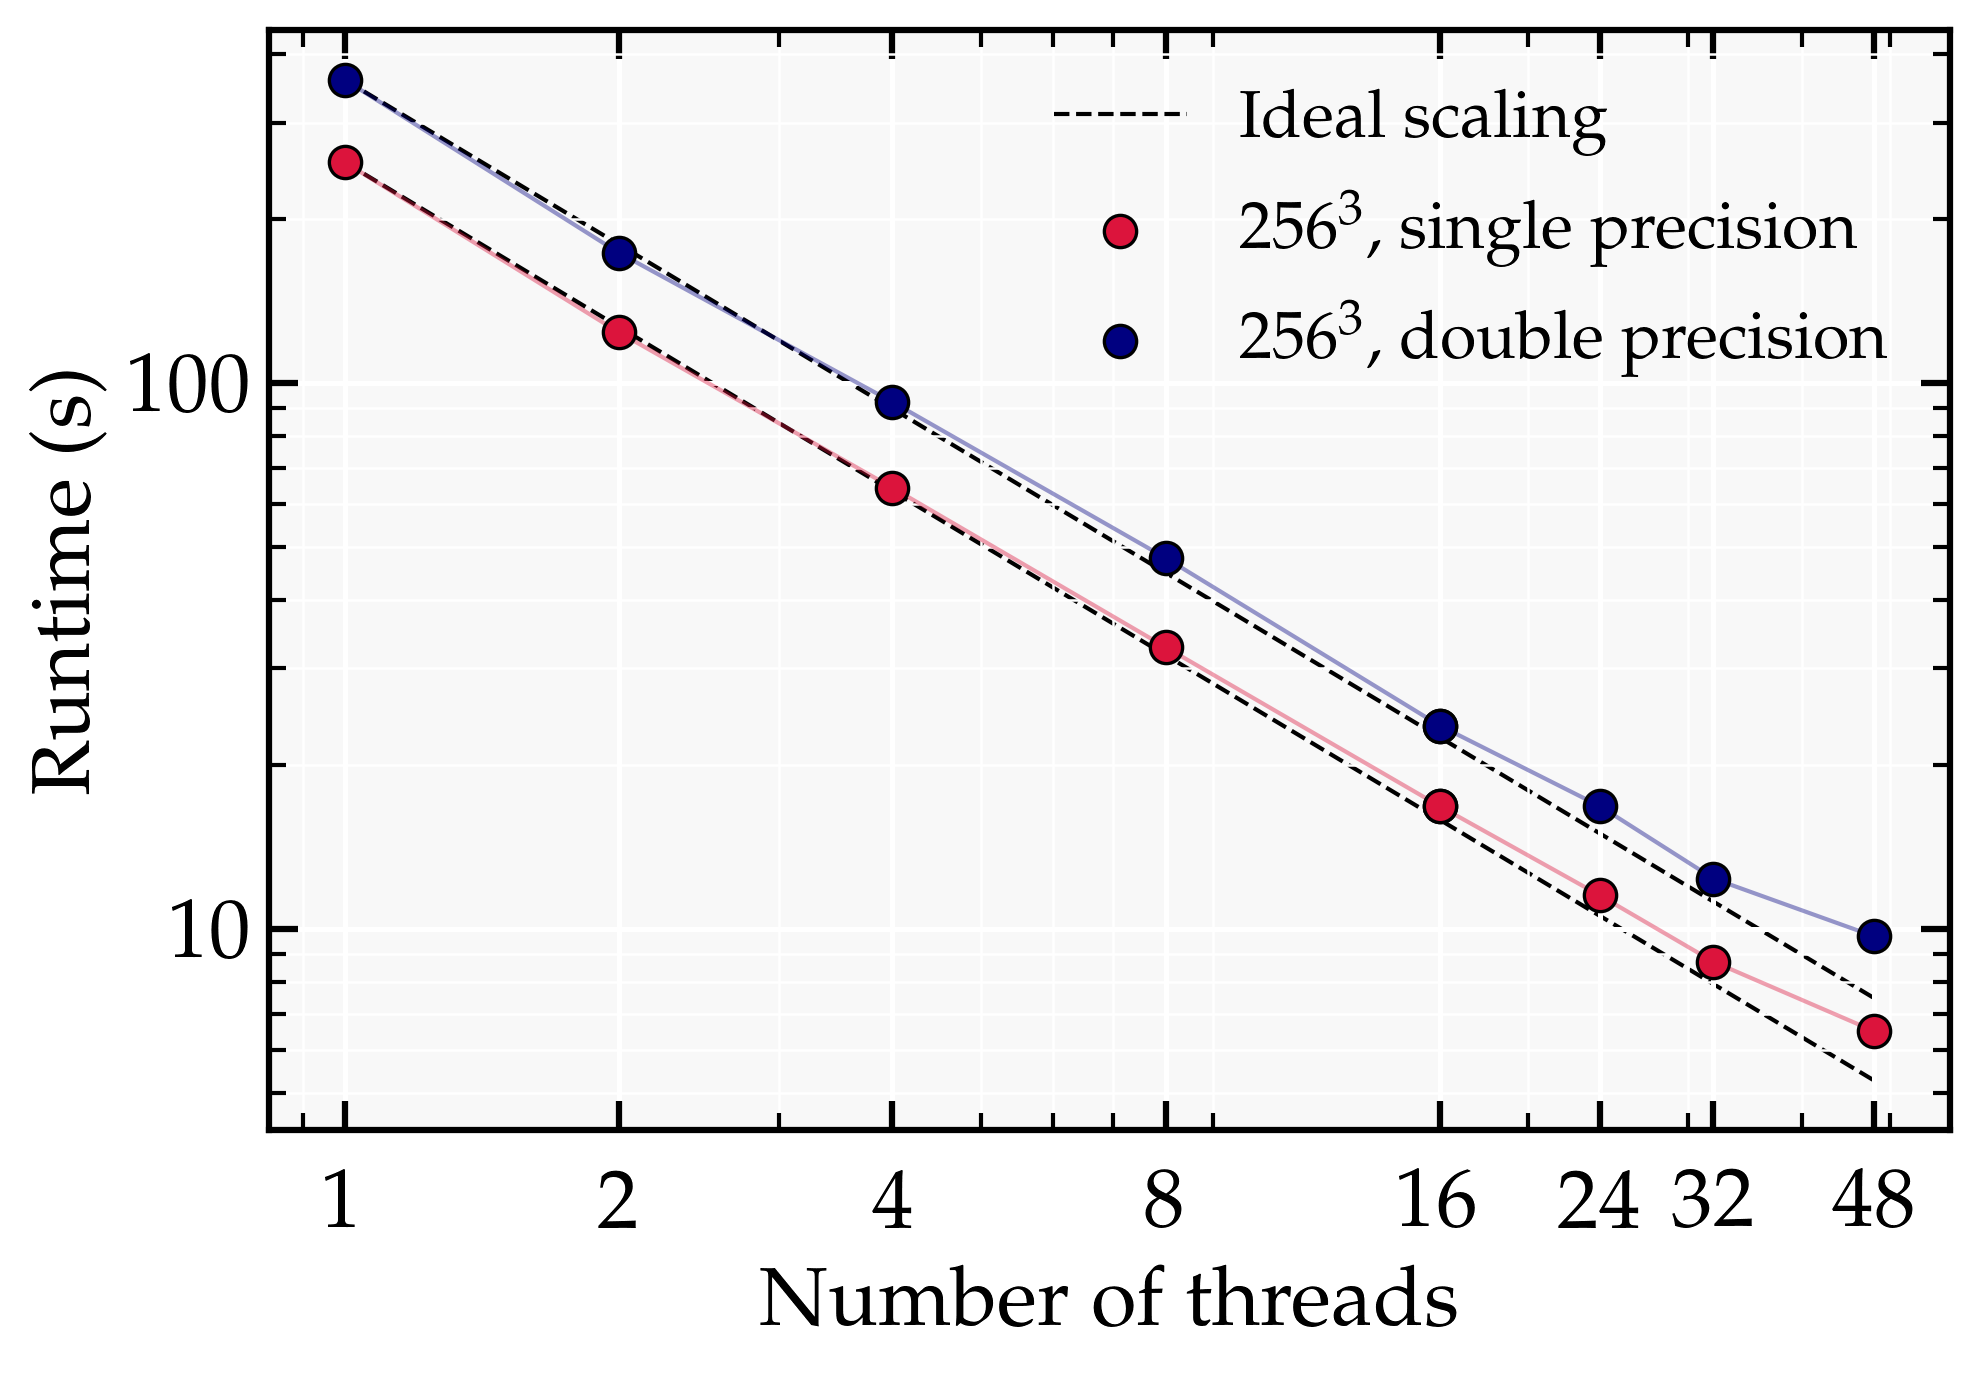
The dashed line shows ideal linear speedup. Deviation from ideal is expected due to communication overhead and non-parallelisable portions of the code (Amdahl’s Law).
CPU vs GPU Runtime
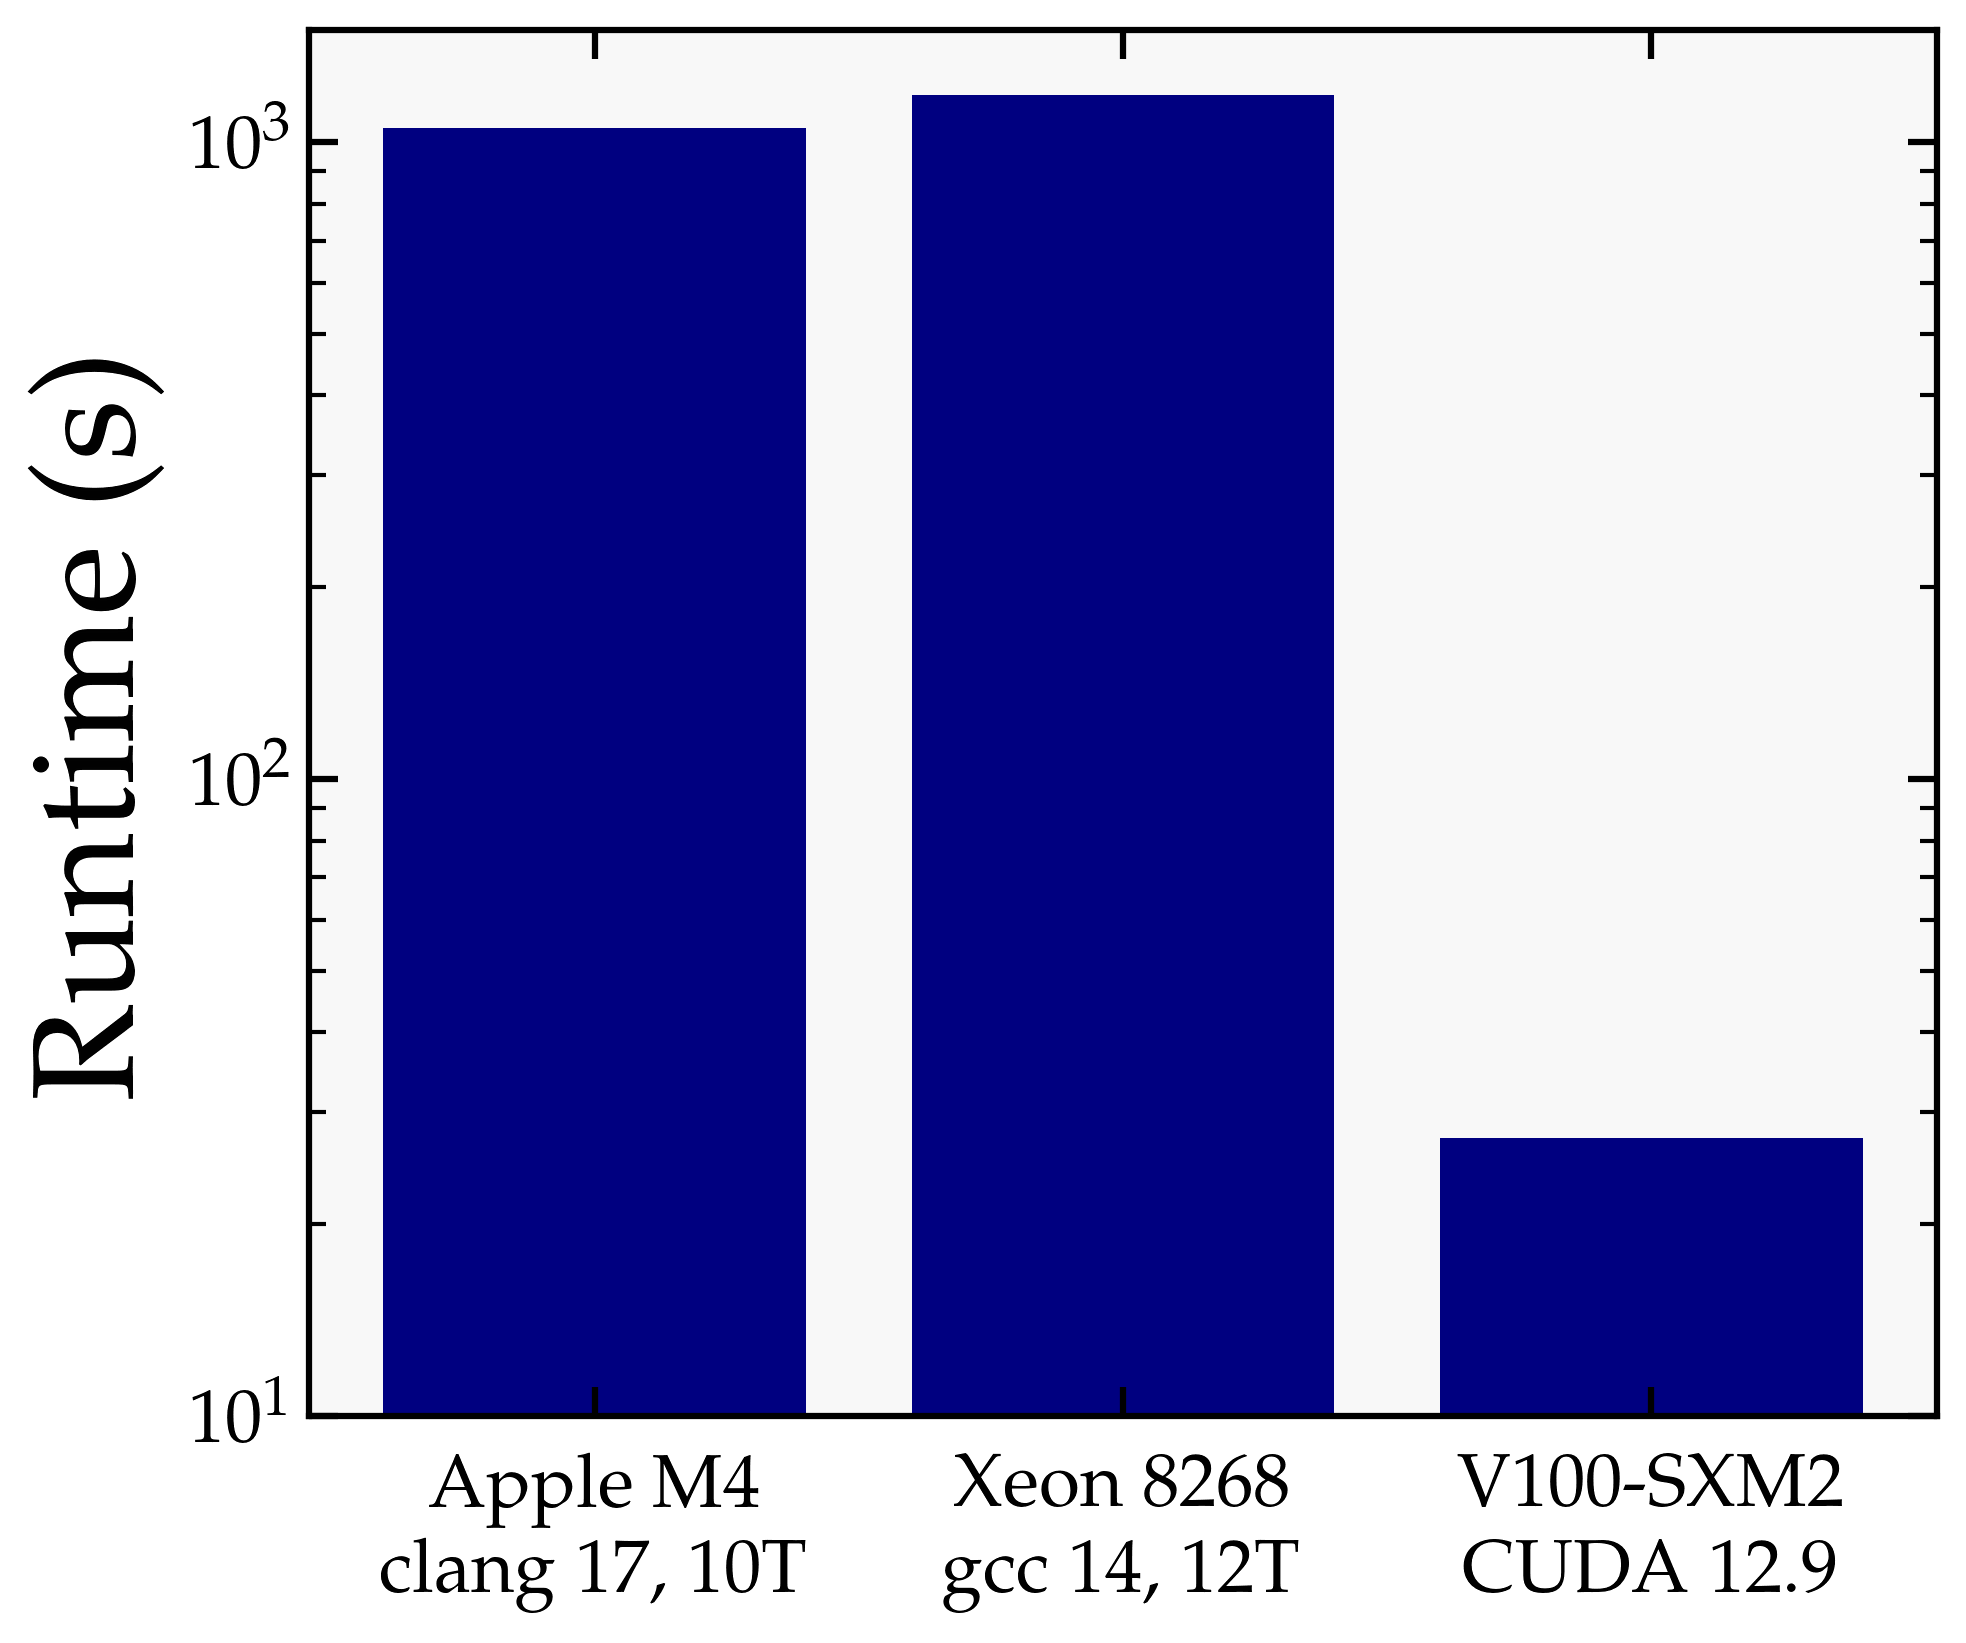
The following benchmark measures the wall-clock runtime of a fixed test run across three platforms:
- Grid size: $256^3$
- Steps: 1000
All runs use the same initial conditions, output settings, and build flags, differing only in the platform and parallelisation backend.
Results
| Platform | Compiler / Runtime | Threads | Runtime (s) |
|---|---|---|---|
| Apple M4 (2024) | clang 17 | 10 | 1050 |
| Intel Xeon 8268 (2019) | gcc 14 | 12 | 1183 |
| Nvidia V100-SXM2 (2018) | CUDA 12.9 | — | 27.3 |
GPU Speedup
The V100 GPU completes the same run in about 27 s, compared to more than 1000 s on the Apple M4 and on the Xeon 8268. This corresponds to a speedup of roughly 39× over the M4 and 43× over the Xeon.
The speedup is driven primarily by the GPU-accelerated FFT (cuFFT), which dominates the cost of each time step at this grid size. The benefit is expected to grow further at larger $N$, where the FFT cost scales as $N^3 \log N$ and the GPU’s parallelism is more fully utilised.
Conclusions
- Strong scaling is efficient up to $\mathcal{O}(20)$ threads, beyond which communication overhead begins to dominate.
- …